Transitioning to New Channels—Phase 1 Deadline Looms
As the Nov. 30, 2018 deadline for stations assigned to Phase 1 of the FCC’s Incentive Auction approaches and stations complete plans for the transition to their new channels, I thought other broadcasters and viewers may be interested in the signal levels I’ve been using to compare coverage from different facilities and optimize antenna designs.
During the transition, many stations will be forced to use auxiliary facilities with reduced ERP, lower height or both, which will impact their coverage while their main antenna is replaced with one for the new channel.
I’ve been working on methods for mapping the coverage loss from auxiliary facilities. I’ll describe one of them here.
REQUIRED SIGNAL LEVELS FOR RELIABLE RECEPTION
Outdoor antennas are now a rare sight compared to 50 years ago, although indications are that interest in them is increasing. For most over-the-air TV viewers in and around urban areas, indoor antennas are more popular.
Some studies have been done to determine the field strengths required for indoor reception. One I’ve relied on was presented several years ago based on field measurements by consulting firm Meintel, Sgrignoli & Wallace (MSW). It showed a field strength of 75.5 dBμV/m, on average, was needed for UHF TV indoor reception.
I use that number in my coverage comparisons, but also check coverage at a higher field strength, 88 dBμV/m, for what I call “easy indoor” reception. An “easy indoor” level means the viewer doesn’t have to spend a lot of time optimizing the antenna location or orientation in order to be able to receive the station. This number provides over 10 dB extra margin compared to the MSW findings and is 40 dB greater than the level required for FCC “Community Grade” DTV coverage.
I use a field strength halfway between the 48 dBμV/m FCC Community Grade level and the 88 dBμV/m “easy indoor” level for what could be called “easy outdoor” or perhaps “indoor with effort” coverage. This signal level takes into account the loss from outdoor antennas lower than 30 feet used in the FCC planning factors, and allows for some loss for antennas installed in attics or sub-optimum locations. It can also work for indoor reception if the antenna is in a window facing the right direction and high enough to clear nearby obstacles outdoors.
While these numbers were originally designed for UHF, I’ve been using them for high-VHF coverage as well. Even though the FCC service contour for high-VHF uses a signal level 5 dB lower than that for UHF, VHF reception is usually more challenging, especially for indoor reception, due to RF noise in the house and lower antenna gain.

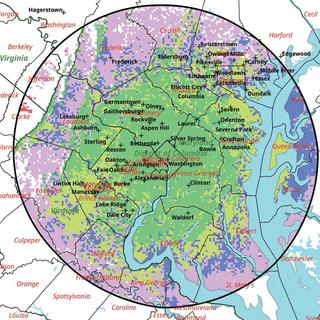
“Channel 48 Main Coverage Thresholds” (Fig. 1) shows Washington D.C.’s WRC-TV main transmitter facility coverage plotted with these thresholds. Green areas are “easy indoor,” above 88 dBμV/m. Yellow-green areas extend indoor coverage to the 75.5 dBμV/m field strength. The blue areas are those where the predicted field strength is between 68 and 75.5 dBμV/m. Finally, the purple areas extend coverage to the FCC noise limited threshold. Cells with no service due to signal level aren’t shaded and cells with interference (there are 33 of them) are red. This map was created using the “coverpts.shp” files from TVStudy and the open source QGIS GIS.
A simpler way to find a station’s predicted field strength at a location is to use the FCC’s excellent DTV Reception Maps at www.fcc.gov/media/engineering/dtvmaps. Enter a zip code or more precise location and click on the station’s call sign for the predicted field strength from that station. This page only displays the facilities currently on the air.
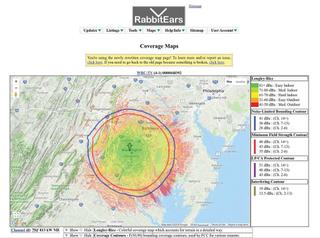
To see a “rainbow” coverage map for any FCC authorized or applied for facility, use RabbitEars at www.rabbitears.info. Enter the call sign of the station on the first page; scroll down until you see the details on the station; click on “Technical Data” and then “RabbitEars TV Query.” On the new page, scroll down to the facility you want and click on “Longley-Rice Coverage Map” at the bottom of the technical details. RabbitEars is more generous than I am, considering signal levels above 80 dBμV/m “easy indoor” and above 51 dBμV/m “easy outdoor.” (Fig. 2.)

The TV Fool website provides many options for displaying signal power in dBm and noise margin in dB on maps and in tables. Using these values instead of field strength makes it easy to calculate the impact of adding antenna gain or amplification on reception. In many cases, however, adding an amplifier will increase the noise and interference along with the signal level and provide no benefit or even worse reception.
Measuring signal level can be done using any number of signal strength measurement instruments.
A bit of time with your favorite search engine will turn up several options. I’m not going to describe them this month, but will provide a tip on an easy and inexpensive way to measure a TV signal’s power in dBm. The Hauppauge WinTV dualHD USB tuner uses a Silicon Labs Si2157 tuner. The Linux “dvb-fe-tool” will display the signal power in dBm of the station currently tuned to in another program, such as Kaffeine, when run as “dvb-fe-tool-m” in a terminal. The program is available for Ubuntu in the “dvb-tools” package. It is also possible to derive MER (Modulation Error Ratio) from the WinTV dualHD using the “femon” command line program, but I haven’t verified the accuracy.
COVERAGE LOSS FROM TEMPORARY REPACK FACILITIES
Many stations will have to use auxiliary or interim facilities while doing antenna and tower work necessary to switch to their new channels. Stations not changing channels on a tower with stations changing channels are likely to be impacted as well. I’ve been looking at some methods to visualize the impact of the use of these facilities on viewer reception. I recommend stations begin operation on their new channel at full power to insure viewers catch the channel during the market rescan even if this results in coverage loss on the original channel prior to the transition.

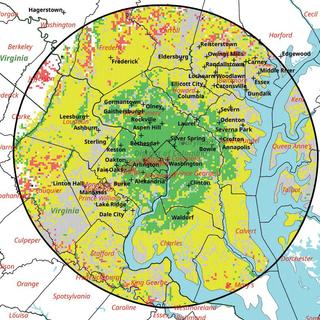
The map “Channel 48 Aux Facility Coverage Comparison” (Fig. 3) is an example of a comparison of the main WRCTV facility and the auxiliary WRC-TV facility. Areas where the signal levels from the aux facility are within 6 dB of the main facility or equal to greater than 88 dBμV/m are shown in green.
Areas where the aux facility is over 12 dB weaker than the main facility are shown in gray. In these areas viewers are likely to have more difficulty seeing the aux facility, perhaps requiring an outdoor antenna if they weren’t using one before or upgrading an existing one.
Finally, areas where the main facility has FCC predicted service and the auxiliary facility does not, either due to signal below threshold or interference, are shown in red. For details on how to create such maps, see my article in the fall 2018 edition of IEEE Broadcast Technology or contact me.
If your TV station is operating at reduced power or on an auxiliary antenna during the repack process, I’d be interested in your opinion on whether the thresholds I’ve used for this analysis match your real-world experience. The example I used in IEEE Broadcast Technology had a narrower threshold (+/–3 dB) for equivalent reception since I’ve heard very few viewer complaints when a station has had to go to 50 percent power. Is 6 dB too generous?
As always, your comments and questions are welcome. Email me atdlung@transmitter.com.
For more information on the repack, visit TV Technology's repack silo.
Get the TV Tech Newsletter
The professional video industry's #1 source for news, trends and product and tech information. Sign up below.
Doug Lung is one of America's foremost authorities on broadcast RF technology. As vice president of Broadcast Technology for NBCUniversal Local, H. Douglas Lung leads NBC and Telemundo-owned stations’ RF and transmission affairs, including microwave, radars, satellite uplinks, and FCC technical filings. Beginning his career in 1976 at KSCI in Los Angeles, Lung has nearly 50 years of experience in broadcast television engineering. Beginning in 1985, he led the engineering department for what was to become the Telemundo network and station group, assisting in the design, construction and installation of the company’s broadcast and cable facilities. Other projects include work on the launch of Hawaii’s first UHF TV station, the rollout and testing of the ATSC mobile-handheld standard, and software development related to the incentive auction TV spectrum repack.
A longtime columnist for TV Technology, Doug is also a regular contributor to IEEE Broadcast Technology. He is the recipient of the 2023 NAB Television Engineering Award. He also received a Tech Leadership Award from TV Tech publisher Future plc in 2021 and is a member of the IEEE Broadcast Technology Society and the Society of Broadcast Engineers.

