Graphics automation
Graphics are an essential component of programs and commercials. Even a drama has opening titles and closing credits. The use of graphics for live programming has grown in sophistication as television has evolved. Where would news be without maps, and where would sports coverage be without comprehensive statistics? Documentaries and factual programs also lean heavily on graphics to help explain.

The problem facing broadcasters is how to meet the demand for more and higher quality graphics without increasing cost. As branding and on-air look become more important, it makes sense to use graphics personnel in the creative role and not as typists. This is leading the migration towards data-driven graphics, in which style can be separated from content.
Coupled to that is automation, where graphics can be created from data feeds without human intervention. Early examples of this were the stock tickers used on financial channels.
Broadcasters could have three departments that use live graphics: news (and weather), master control and sports. The outside broadcast fleet can use the sports graphics systems for any live event, but sports tend to be the most demanding. There are also special events that place tremendous demands on the graphics department, with election coverage being the pinnacle.
Although much graphic content is added in post-production, for live graphics, it is common to use modular graphics systems that have a direct lineage from the original character generators and stills stores.
In order to rationalize the airing of live graphics, the systems generally comprise content creation tools, an asset repository, data entry (by a journalist or from a data feed) and the rendering hardware that generates the final graphic. Data-driven graphics have revolutionized what is possible with television graphics, with the most advanced products being a key part of election coverage and the coverage of major sporting events.
Content creation
Get the TV Tech Newsletter
The professional video industry's #1 source for news, trends and product and tech information. Sign up below.
Data-driven graphics mean that designers can concentrate on the look and style. Someone else can add the text. Graphics designers will find little difference between using a graphics system rather than a standalone CG. Once created, a graphic or template is filed in the asset management repository. If the workflow demands, a notification is sent to potential users of the graphic.
Most graphics start out as Photoshop or After Effects files. These are uploaded to the graphics workstation and then used to build the template. This can be a simple form with text fields for journalists to complete. An application such as Miranda's Vertigo Xmedia allows a template to incorporate further components — animations, DVE effects and audio controls.
This flexibility means endless creative opportunities. Imagine an election graphic; as a poll result is displayed, an appropriate image of a politician could be loaded. A good result means a smiling shot, while a poor result means a shot in which the politician looks tight-lipped. The logic to build this can all be incorporated into the template. Picture editors can load the images as a completely separate operation from the design of the graphic template. They can tag each image to suit the requirements of the logic.
Repository
The graphics department has been one of the first areas of broadcast to fully use asset management. There's nothing new here; graphics designers use content management systems as an aid to building large web sites, and stock image libraries have moved from the printed catalog to an online service.
Enabling technology
Most systems use standard interface protocols to allow the graphics system to intercommunicate with the rest of the broadcast plant. The first standard was the Intelligent Interface developed by Chyron for the Infinite CG. This has become a de facto comms protocol for controlling graphics equipment. Later, AP facilitated the development of the MOS protocol, which was aimed at news applications. MOS is well supported by graphics products.
More recently, XML has been adopted for more complex data exchange. XML, along with a data dictionary or schema, eases the development of custom interfaces — a necessity for many bespoke data-driven applications.
MOS protocol
Developed in 1998, MOS provides a standard means for newsroom computer systems (NRCS) to control what were termed media object servers. These are nonlinear storage devices for CG pages, stills, and video and audio files.
The protocol supports three message types. As files are saved to the server, their presence is “published” to the newsroom computer with descriptive data. The NRCS can transfer rundowns to the media servers as playlists. The third message type is status information, which can be exchanged between the NRCS and media server.
Automation
One of the biggest cost-savings for broadcasters has stemmed from the automation of data-driven graphics systems. A simple example would be the display of external temperature. More recently, sophisticated systems process and parse data for display as a graphic. Many examples can be seen in master control, where schedules are processed for promos.
Rendering the output
There are several options for rendering the real-time graphics. The special hardware platforms of the past have been replaced with a regular PC platform fitted with proprietary graphics cards or high-performance commodity graphics cards that are available as OEM products. Conventional graphics cards are not suitable for CG applications. A card needs SDI outputs, may incorporate a video keyer and SDI inputs, and must genlock to house sync in order to make the PC platform “broadcast-friendly.” They may also include audio facilities for voice-overs and general audio playback.
Real-time control of the rendering engine may use the Intelligent Interface or a proprietary API. In many applications, there may be a mix of control. MOS commands could be used to load data into pages, and Intelligent Interface used to take the page to air.
Channel branding and promotions
In master control, the majority of content that is added to the program schedule is of a graphic nature. Most broadcasters now use snypes or in-program promotion to entice viewers before the commercial break, while squeezebacks allow more time for interstitial promotions.
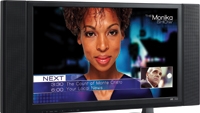
The information displayed by the graphics is a mix of programs scheduled for the next few days (tomorrow, next week) and real-time (at 21:05 tonight). The need to create these manually involves much data re-entry and endless repetitive voice-overs. The sheer human effort limits the number of promos that can be created. By automating the graphics, human resource can be redeployed to more creative tasks, such as creating more promos.
It sounds easy, but many traffic systems were deigned long before the demand for such features. However, all broadcasters create advance listings for the TV guides and EPG systems that contain the relevant information that can be extracted by parsing with a suitable algorithm. Exact timing on the day of transmission is under the control of playout automation. Combining the EPG data (the schedule) with exact timing available in the automation playlist means that virtually all the needed information for the graphics can be derived.
News
MOS is now a mature technology to interface newsroom systems with graphics systems. The first application was for journalists to add captions to lower thirds. As graphics have become more sophisticated, some vendors have developed plug-ins for common NRCSs. These allow journalists to search and recall a template, and then fill out the text fields, all from their standard NRCS desktops.
Now that news organizations are airing user-generated content from “citizen” journalists, news graphics systems are evolving to accept these new formats. With the proper gateway for MMS images and video, a system can convert them to JPG and AVI for use as media object is a MOS infrastructure. The public can simply e-mail their content to the broadcaster. Any such ingest system must include a firewall to protect the broadcast system.
Today, it's possible to incroporate content from a 3G-UMTS phone into a news broadcast with the proper equipment. This allows journalists to air breaking news pictures before camera crews arrive.
News automation
A proportion of on-screen graphics can be processed automatically from agency feeds. Breaking news, weather, financial market data and even horoscopes are all available as feeds. They have long been available as simple text crawling along the bottom of the screen, but current graphics systems can do much more. Often the ticker can be displayed as a 3-D object that can be scrolled around a real object such as the anchor's desk. Animations can be incorporated into some tickers for advertisements.
Maps
No newscast would be complete without a map showing the location of the event. Maps are an integral part of weather forecasts. Map databases and automation have transformed the use of maps, radically lowering the day-to-day input from graphics operators.
The old 2-D maps have been supplanted with 3-D relief maps that can show the terrain. Map applications allow the graphic designer to very quickly animate maps for sequences like flight paths. The automation means that weather data can be rendered as symbols directly to the map.
Sports
Sports viewers expect stats about the team, the players and the dynamics of the game. This has to happen in real-time, but there are two different processes taking place. The stats are pulled from a database, along with still images of players. The dynamic information must be created on-the-fly. There are several specialist software companies that use information from sensors in the field of play and process that into information that can be used by a CG to display the relevant data.
Aside from scores and statistics, another important area for sports production is advertising. Hoarding can be placed around the field of play, but for international events, they can only be used for global brands. It is now perfectly possible to key graphics over the picture and to track camera movements so the graphics appear as part of the scene. The graphics could be advertisements, or they could relate to the sport.
An advantage of virtual advertisements is that different spots can be used for different feeds, so advertising can be targeted to each outgoing feed.
Elections
Election graphics present the greatest challenge to broadcasters. They can use all of the components of a graphics systems orchestrated to give a comprehensive meld of live action, results and statistics.
The virtual studio and automated data-driven graphics are all combined in systems specially assembled for the occasion. Predictions and live data feeds are processed in real time to fill the templates. Election coverage applications use large external databases to manage the many sources of information.
Multiformat issues
Formatting graphics for multiple delivery formats is only commercially feasible with automated data-driven graphics. Many broadcasters need to create graphics for 4:3 SD, 16:9 HD and small 240 x 320 pixel images for mobile devices. The character height of text for optimum readability is related to the number of TV lines, so HD can naturally support around twice the number of lines of text on the screen as SD and still be readable. Were the HD to be downconverted to SD, small text sizes could become unreadable. This raises the question: Should HD viewers be given more text in their graphics?
If content is separated from presentation, then such reformatting becomes much easier. Fields can be tagged as broadcast to all (including small screen mobile) or only to be rendered for HD viewers.
Summary
The separation of style and content is transforming television graphics. It frees creative personnel from the role of a typist, data ingest and collation can be automated, and multiformat delivery — HD down to mobile — is much simplified.
The power of commodity computer platforms means that real-time rendering of 3-D content has become commonplace. Incoming data feeds can be rendered to the screen in a few seconds. The improved productivity that can be achieved with the current pick of systems means that broadcasters can create a better on-air look and present more useful information to viewers. In the competition for eyeballs, this cannot be ignored.
