The Standard Eye and Other Inconsistencies

Bill Klages
Just when we were feeling comfortable with the CIE photopic response curve of 1924, we discover that this standard has been completely incorrect for nearly ninety years.
Before you enter into a state of complete despair and consider another career, we will try to determine what effect this error will have on the entertainment lighting industry. What changes will you need to make in your current operating method to accommodate this significant revelation?
EYE CELLS
First, we have to present some of the basic concepts of vision and the perception of color. You may have heard this before but, for completeness, a review is necessary.
The eye is composed of four types of photoreceptor cells, cells that respond to electromagnetic radiation over a very specific range of wavelengths—the visible spectrum. The first are rod cells, which are not color sensitive and respond at very low light levels. (Think “night vision.”) This type of vision is called scotopic. We need go no further with this as the light levels we are concerned with are much greater than for this type of vision.
The second group is the cone cells and these operate throughout the broad range of general vision. This type of vision is called photopic. There are three types of cone cells and each responds to specific a group of wavelengths that are roughly red, blue and green. Because of this fact, only three numerical components corresponding to these three receptors are necessary to describe the colors we see. In other words, we were blessed with a tri-stimulus color capability before Newton’s great color theory. During photopic vision, the eye is also capable of adapting to a wide range of illuminance levels, light levels that go from moonlight to sunlight. An amazing device.
PAINTING
Color systems are idealized as being composed of two sets of information. First, we have the luminance information, which is related to the eye’s perception and sensitivity to brightness only. (Think of it as a monochrome signal.)
Get the TV Tech Newsletter
The professional video industry's #1 source for news, trends and product and tech information. Sign up below.
We then paint this signal with the color information to restore the basic color image. It is the way that television’s color signal is generated. It happened this way as a result of a curious, but convenient, set of circumstances.
THE EARLY DAYS
When commercial television started, the camera contained only a single sensor, an electron tube with a photo-electric surface sensitive to radiant energy. As fate would have it, the sensitivity of this device to the spectrum was not the same as that of the eye. It did not respond to the visible spectrum in the same manner as an eye.

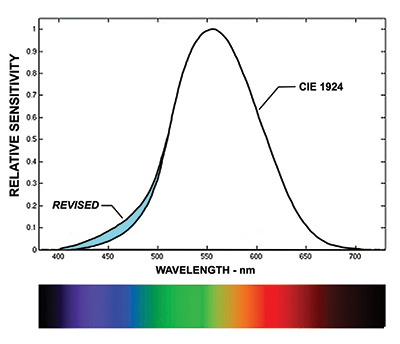
Fig. 1: Luminosity Function (Photopic) A great deal of experimentation was done to approximate the eye’s spectral response. For example, a common early imaging device was extremely sensitive to the infrared portion of the spectrum. Filters were placed in the camera to limit not only the infrared region, but the ultraviolet end of the spectrum as well.
To complete this task, test groups of people were assembled and asked to evaluate pick-up devices with various spectral responses as well different transfer functions (“gamma”) and to judge them as to their ability to produce “perfect reproduction.” They viewed the real scene and then the scene viewed on the display device of the time, the cathode ray tube. The early image orthicon camera was the result.
Of course, without the color information— only luminance—it could hardly be “perfect reproduction.”
In addition, because of the impossible task of obtaining a reasonable signal-tonoise ratio, the end result was heavily compromised to mask this defect.
When television went to color, one of the early issues was that all existing blackand- white sets needed to be able to receive and view the new color signal. As a result, the portion of the new color signal that the older sets would respond to was proportionate to the luminance property of the image. Meanwhile, the color information was separate, waiting to be painted on this signal when viewed on a color television set.
RETURNING TO 1924
Let us return to 1924. The CIE or Commission Internationale de L’éclairage was established in 1913 as the international authority on light, illumination, color and color spaces. In 1924, it defined the “standard photopic observer” and published the famous curve that shows the standard eye’s response to the wavelengths of the visible spectrum.
The manner in which the “color” information was removed so that the test subjects were only comparing the luminosity of individual narrow bands of wavelengths to the luminosity of the wavelength of 555 nanometers (the green wavelength where the eye is most sensitive) is quite interesting and perhaps was the direct cause of the dilemma of today.
TODAY
What has happened in further studies over the years is that, as testing techniques were refined and the sample has increased, the standard observer has been redefined. What the scientists realized was that the sensitivity of the standard eye in the blue end of the spectrum was actually quite a bit more sensitive than had been determined in 1924.
In Fig. 1, the blue area represents the differences that resulted from this later research. Just so you know, the most current group of researchers chose a group of 40 subjects, ages 18–48, which includes five females. I’m not sure how this compares with the group of 1924.
For illustration, if we compare the two results at the wavelength of 450 nanometers (a deep blue), we see that even if the response of the eye at this wavelength is low relative to the sensitivity maximum value at 555 nm, the ratio of the new-toold value at 450 nm is easily two times, a significant departure.
So what?
As more and more sources with discontinuous spectrum were used—fluorescents and now, LEDs—lighting people were aware and confused by the fact that blues appeared much brighter to the eye than their light meters indicated. Light meters are monochromatic devices whose sensitivity is based upon (you guessed it) the Luminosity Function.
To rectify this part of the dilemma is quite simple, but encumbered with an impractical reality. In order to correct this inadequacy, every incident light meter in existence will have to be thrown away and a new, more accurate meter purchased (after some redesign, of course).
Attempting to alter the sensitivity of the meter to match the new, corrected CIE curve, would probably invite the development of a new, but very questionable cottage industry.
WE’RE OKAY IN TV LAND
From a very rigorous viewpoint, we should also change the algorithms that are applied in camera circuitry to obtain the luminance signal. But these formulas have not been appreciably altered since the beginnings of color TV. They would have to be tested with groups similar to the 40 subjects under controlled laboratory conditions to detect the departure from the ideal.
I think we can safely say that the luminance signal of a camera is close enough for “perfect reproduction.”
We need only plan for a new, improved light meter.
Bill Klages would like to extend an invitation to all the lighting people out there to give him your thoughts atbillklages@roadrunner.com.
