Live TV From a Pay TV Service Remains The Most Common First Stop For Viewing
28% say that linear channels from a cable, satellite, or telco TV subscription is their TV home base, according to a new survey from the Hub; Netflix is second, at 23%

BOSTON, Mass.—While live linear TV viewing continues to decline, a new study from the Hub is reporting that across the entire TV viewer base, live TV from a traditional pay TV service remains the most common first stop for viewing.
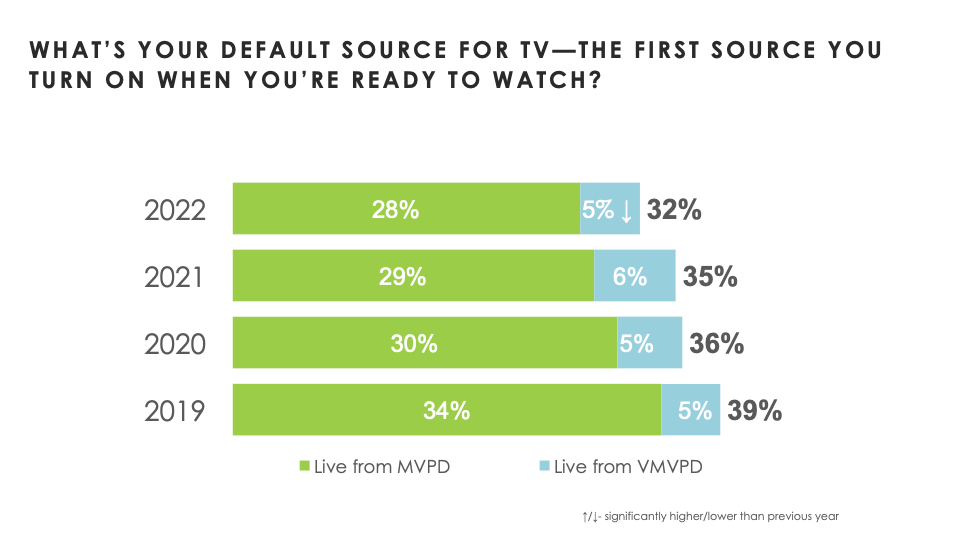
Hub’s annual “Decoding the Default” study, which tracks the TV source that consumers turn on first when they’re ready to watch, found that 28% of respondents say that linear channels from a cable, satellite, or telco TV subscription is their TV home base. Netflix is a close second, at 23%, while no other individual source reaches double digits.
Nearly two in five (39%) respondents, however, reported that they started viewing at one of the top six streaming services, the study found.
Only 5% started with an over-the-air broadcast service, about the same as the 5% who started with a virtual MVPD.
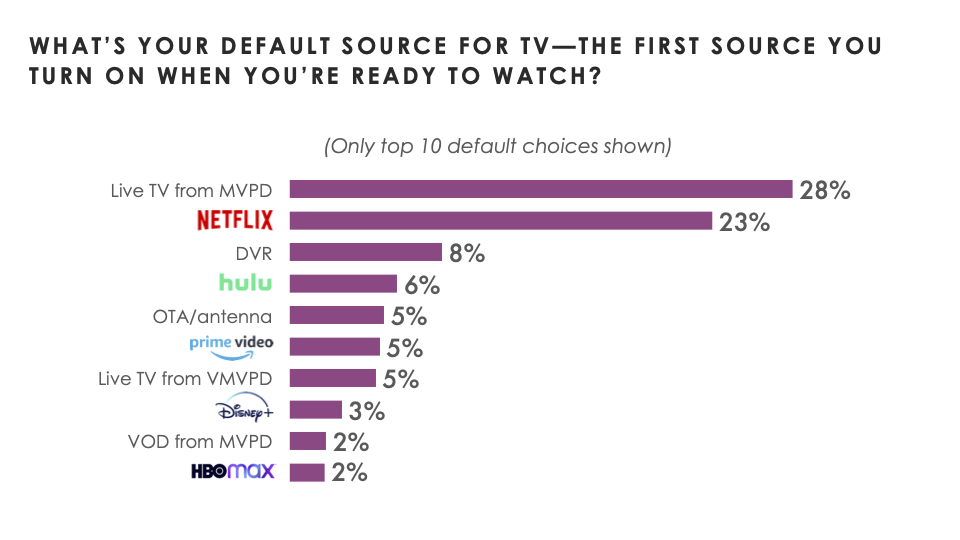
But the researchers stressed that live TV has been dropping steadily as a default source over the past seven years, and is at its lowest point they began measuring default sources. Netflix reached a saturation point as a default in 2018 (23%) and has been fluctuating around that level ever since.
In contrast, the other “Big 5” streaming subscription services have made more consistent gains. While no single service in this group comes close to Netflix, in combination they’re now just 7 points behind.
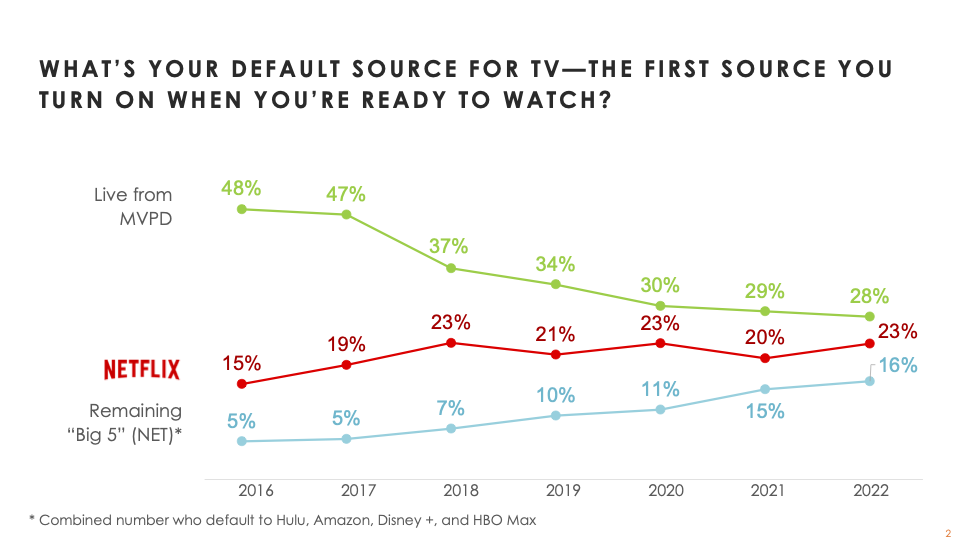
The study also found that the declines in linear from traditional pay are not significantly improved when one adds in linear from Virtual MVPDs. If anything, adding in live from VMVPD shows an even more pronounced decline for live TV in general as the first stop for TV. The percent turning first to VMVPD has not risen above 6% since we started measuring defaults.
Get the TV Tech Newsletter
The professional video industry's #1 source for news, trends and product and tech information. Sign up below.
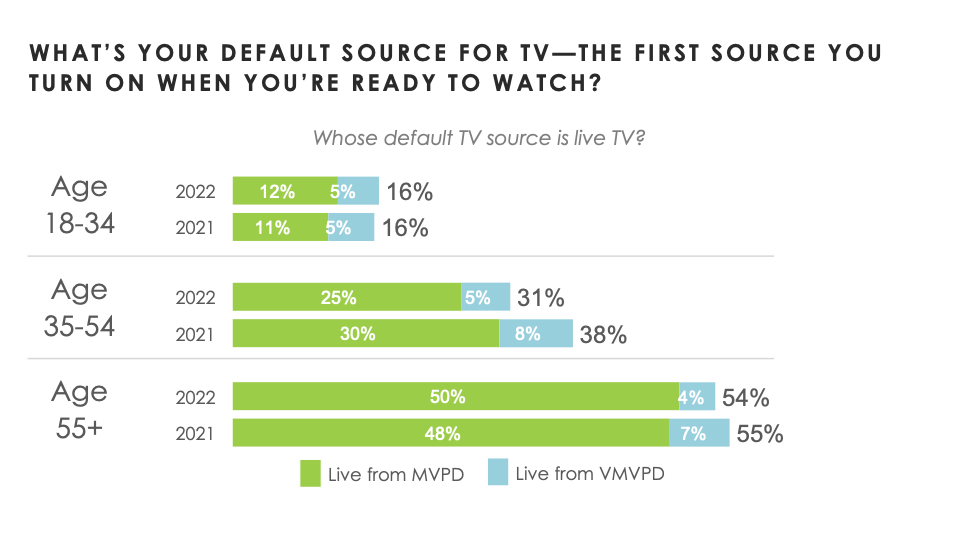
Overall, the percent defaulting to any live TV subscription is only 32% in 2022, 3 points lower than in 2021 and 7 points lower than in 2019.
The study also found that the choice of a default starting point for viewing is dramatically different by age.
Among 18-34 year olds, 38% make Netflix their first viewing choice—more than 3 times the proportion who default to a traditional live source.
On the other hand, half (50%) of 55+ year-olds turn first to pay TV linear channels, more than 5 times the percent who make Netflix their first viewing stop.
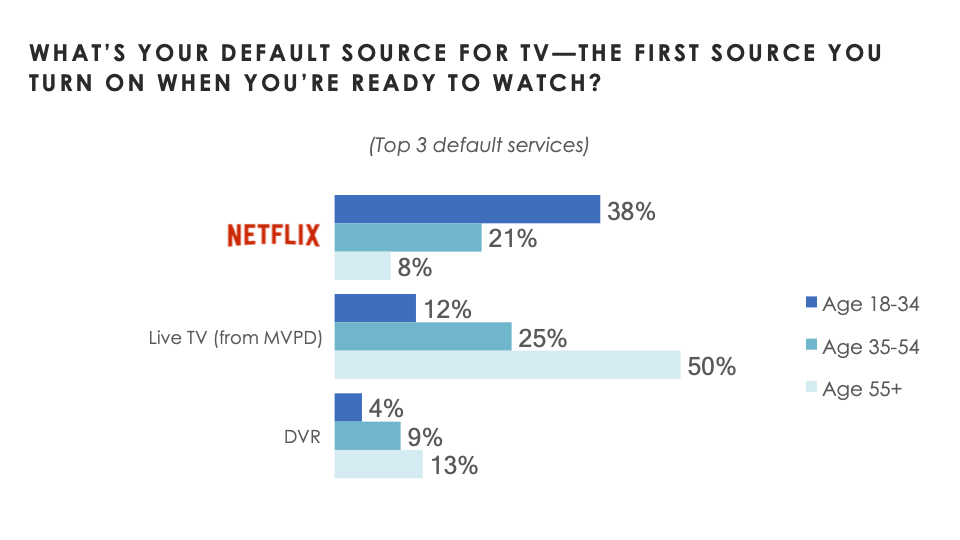
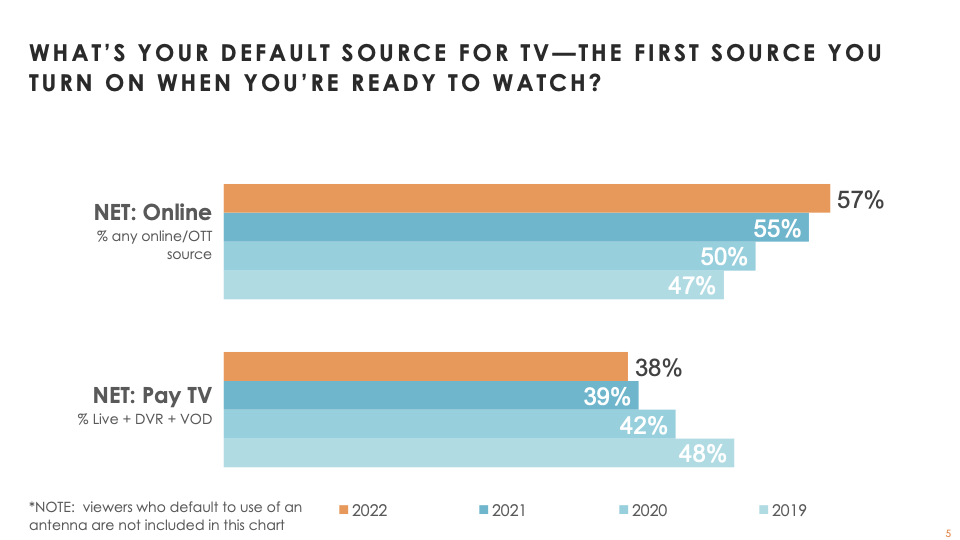
Although live from traditional TV still hangs on to a slim lead as the top individual default source, online sources in general dominate traditional pay TV sources in general, the researcher wrote.
And that dominance has increased since even last year: 57% make an online source their TV home (up from 55%) last year, while 38% default to a source from a pay TV set-top box: live, DVR, or VOD (down from 39%).
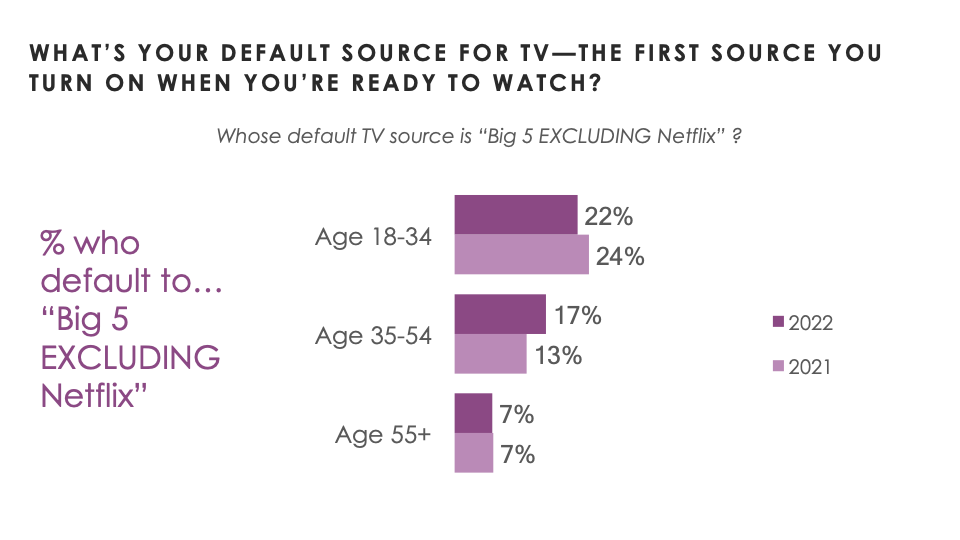
The small proportion of 18-34 year olds, and the large proportion of 55+ year olds, who default to some live source hasn’t changed since last year. But 35-54 year olds are now 7 points less likely to default to live, the report found.
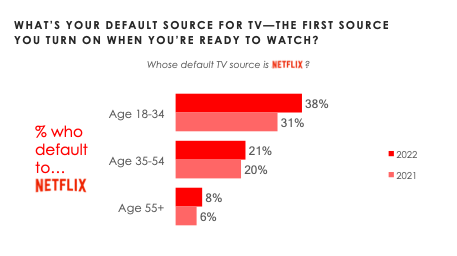
The proportion defaulting to Netflix has not changed among 35-54 or 55+ year olds. But after dipping between 2020 and 2021, Netflix is up 7 points as a default among 18-34 year olds.
The drop for live among 35-54 year olds comes with an increase of 4 points defaulting to a Big 5 SVOD other than Netflix among this age group, Hub found.
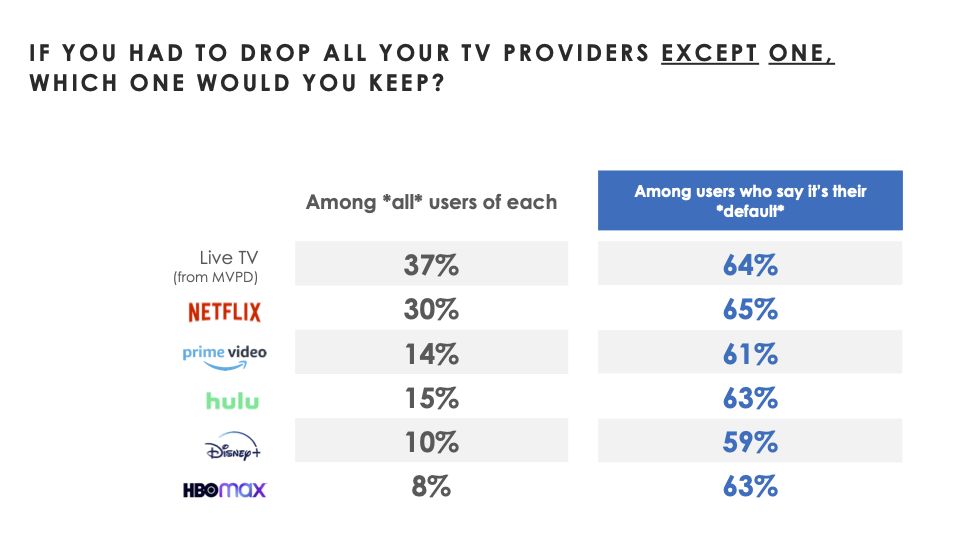
The survey also found that being a default service is important because those who default to a service are dramatically more likely to remain loyal to it.
As part of the survey, Hub asked consumers to select which of the TV services they currently have they would keep if they had to drop all services except one. Among all subscribers to traditional pay TV service or each of the Big 5 SVODs, anywhere from 8% to 37% name each as the service they’d hang on to if they had to drop all others.
But among those who default to each of those services, the percent saying it would be the one service they’d keep jumps dramatically, to anywhere from 59% to 65%.
“At a time when the typical TV consumer uses an average of 7.4 different sources of TV content (Hub, The Best Bundle, 2022), simple penetration of a service in the marketplace is no longer a reliable measure of long term service success,” said Peter Fondulas, principal at Hub and co-author of the report. “A much better predictor is how much consumers engage with each service they have—and in particular, which they consider their TV viewing home base.”
The data cited here come from Hub’s “Decoding the Default” study, conducted among 1,600 US consumers with broadband, age 16-74, who watch at least 1 hour of TV per week. The data was collected in August 2022.
George Winslow is the senior content producer for TV Tech. He has written about the television, media and technology industries for nearly 30 years for such publications as Broadcasting & Cable, Multichannel News and TV Tech. Over the years, he has edited a number of magazines, including Multichannel News International and World Screen, and moderated panels at such major industry events as NAB and MIP TV. He has published two books and dozens of encyclopedia articles on such subjects as the media, New York City history and economics.

