Live TV Rules, Broadcast Reliance on the Rise in U.S.
Fig. 1
Click on the Image to Enlarge
NEW YORK—Americans like TV on TV. They also prefer live TV, and more are relying exclusively on over-the-air TV. Those are some of the takeaways from Nielsen’s “Total Audience Report” for 2Q 2015.
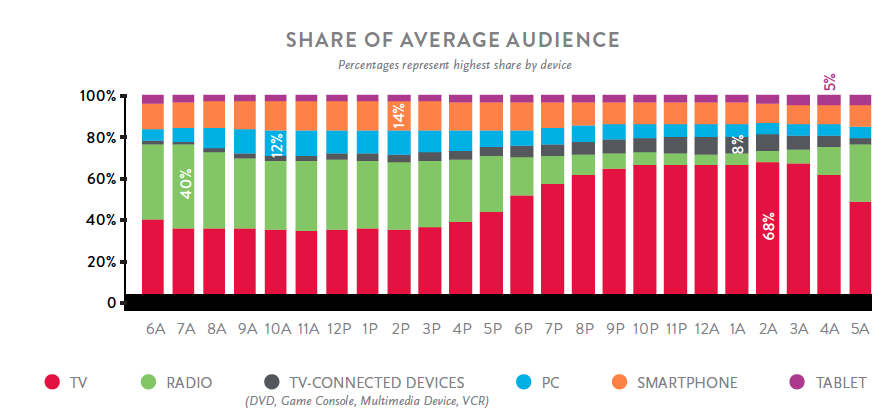
In terms of watching TV on a TV, that would be versus using a TV-connected device like a game console, a tablet, smartphone or PC, or listening to the radio. During weekdays in May, among people 18 and over, and between 6 a.m. and 6 p.m., TV accounted for “half of all media use,” the report said. Viewership rose above 60 percent during prime time to a peak of 68 percent at 2 a.m. (Fig. 1)
Fig. 2
Click on the Image to Enlarge
Only radio challenged television for audience share at any point during the broadcast day, when it peaked at 40 percent during the 7 a.m drive-time hour. By comparison, smartphone audiece usage peaked at 14 percent at 2 p.m. PCs peaked at 10 a.m. with 12 percent; tablets, 5 percent at 4 a.m.; and connected TVs peaked at 8 percent at 1 a.m.
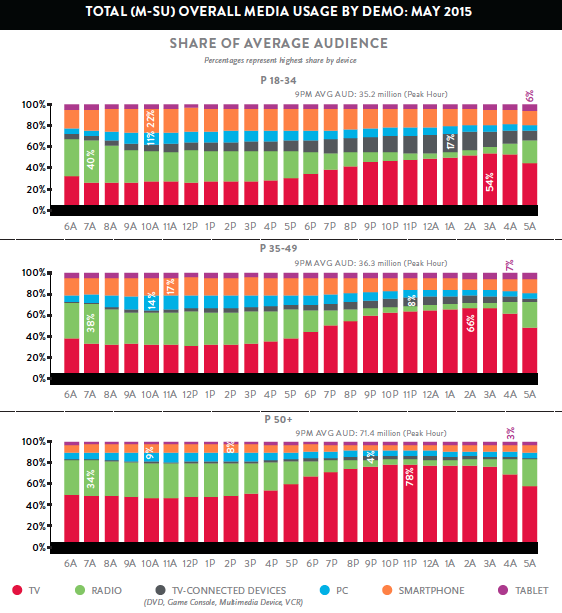
These usage patterns were reflected across demographic groups, though TV viewing increased with age. (Fig. 2)
Fig. 3
Click on the Image to Enlarge
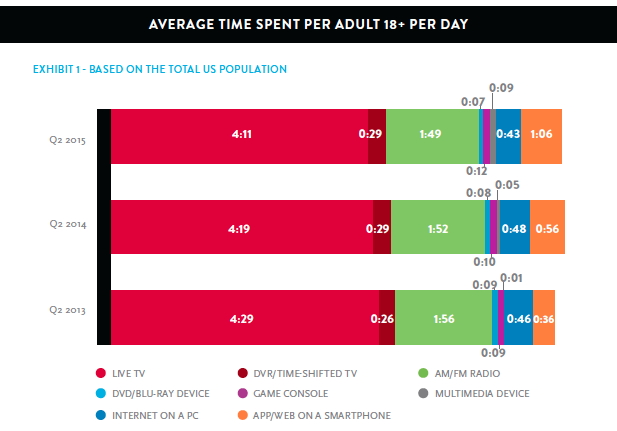
Live TV dominated consumption with more than four hours daily over the last three years, but down from the previous two years to four hours, 11 minutes. (Fig. 3) For 2Q 2015, time-shifted viewing comprised 29 minutes of the viewing day; DVD/Blu-Ray, seven minutes; game consoles, 12 minutes; “multimedia devices,” nine minutes; Internet on a PC, 43 minutes; smartphone (app or Web), 1 hour, six minutes. People listened to the radio on average one hour, 49 minutes during the same peiod.
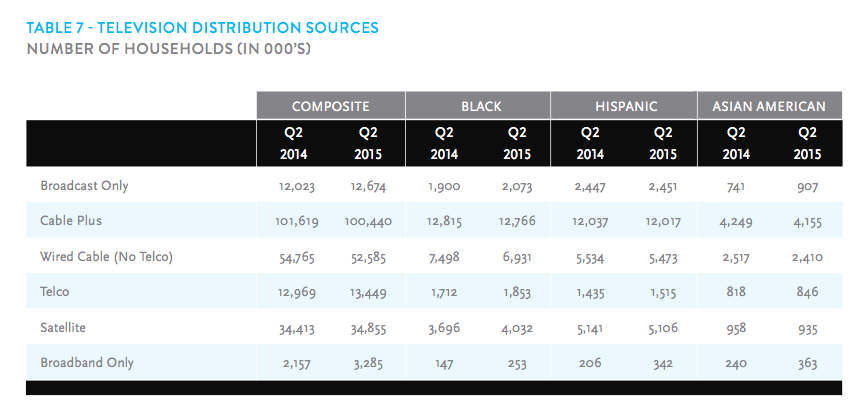
In the report, Nielsen found there are now 12.674 million broadcast-only homes, an increase of 651,000 homes from the same quarter last year. (Fig. 4) The report also found the number of broadcast-only homes with no Internet service increased by 561,000 homes compared to a year ago.
Fig. 4
Click on the Image to Enlarge
OTA-only homes compared to the number that rely on telcoTV, up from last year’s 12.969 million to 13.449 million. Wired cable—including wired cable, telcoTV and satellite—eased down from 101.6 million homes last year to 100.4 million this year. Satellite accounted for 34.4 million last year versus 34.9 million this year. Broadband-only houseolds went from 2.2 million last year to 3.3 million this year.
Get the TV Tech Newsletter
The professional video industry's #1 source for news, trends and product and tech information. Sign up below.
