NTIA releases National Broadband Map, survey results

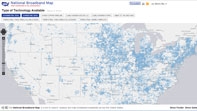
The National Telecommunications and Information Administration (NTIA) has published its National Broadband Map, an online, searchable map of broadband Internet availability.
Congress had given the Commerce Department agency until Feb. 17 to complete and make public the nationwide map. The U.S. map gives users access to a variety of data, including maximum advertised upload and download speeds, the type of technology in use, the number of broadband providers, broadband availability across demographic characteristics and tested vs. advertised broadband performance.
According to an NTIA announcement, the map not only provides the public with information about broadband availability and options, but also provides public policy makers with information needed to expand broadband access and adoption, particularly “in communities at risk of being left behind in the 21st-century economy.”
NTIA and the FCC collaborated on creating the map. The map relies on data from each state, territory and the District of Columbia collected from broadband providers or other data sources; more than 25 million searchable records make up the map. Users can search by address to find the broadband providers and services available in the corresponding census block or road segment, view the data on a map or use other interactive tools to compare broadband across the country.
“The National Broadband Map shows there are still too many people and community institutions lacking the level of broadband service needed to fully participate in the Internet economy,” said Lawrence Strickling, assistant secretary for communications and information and NTIA administrator, in a statement released to the press.
The NTIA also released Feb. 17 a report based on data collected from 54,000 households as part of the Internet Usage Survey commissioned by the agency and conducted by the U.S. Census Bureau in October 2010.
Among the findings were the following:
Get the TV Tech Newsletter
The professional video industry's #1 source for news, trends and product and tech information. Sign up below.
- 68 percent of households have broadband access;
- People with low incomes, disabilities, seniors, minorities, the less-educated, nonfamily households and the nonemployed lag behind other groups in home broadband use.
- 70 percent of urban households and 60 percent of rural households accessed broadband Internet service in 2010;
- The most commonly cited reason (46 percent) for not having broadband in the home is that it’s not seen as being needed.
- The second most common reason (25 percent) is that it’s too expensive.
- Lack of availability is the reason cited by 9.4 percent in rural areas vs. 1 percent in urban settings who cite unavailability.
- 28.3 percent of all people do not use the Internet.
This report is available from the NTIA website. In the coming months, the Census Bureau will provide NTIA with more geographically detailed data.
Phil Kurz is a contributing editor to TV Tech. He has written about TV and video technology for more than 30 years and served as editor of three leading industry magazines. He earned a Bachelor of Journalism and a Master’s Degree in Journalism from the University of Missouri-Columbia School of Journalism.

