TV Sets Outnumber People in U.S. Homes
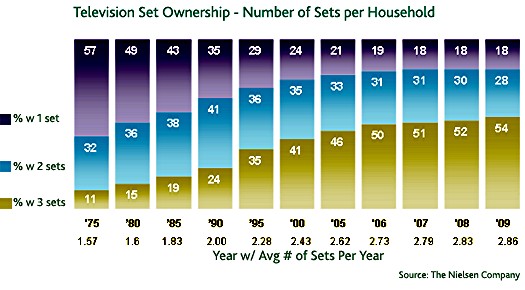
NEW YORK: American homes shelter more TV sets than people, according to the just-released 2008 Television Audience Report from Nielsen. The average number of TV sets per home is 2.86, versus 2.5 people. The per-home count of TV sets represents an 18 percent increase over 2000, when Americans had an average of 2.43 TV sets per home. The average number of people per TV household has remained at around 2.5 since 1990, when each home averaged about two TVs apiece.
More than half of homes had three or more TV sets in 2008; 28 percent had just two, and 18 percent of the 114.5 million U.S. television households had just one set.
PEOPLE
As for the folks living in TV households, women are on the decline while men are increasing. Women 35 and older outnumber men, who dominate the 18-34 demographic.
RECEPTION & PERIPHERALS
Among other findings, Nielsen said that 11 percent of TV homes rely on over-the-air reception; 38 percent have digital cable; 88 percent had a DVD player; 72 percent, a VCR.
BROADCAST CHANNEL GROWTH
The over-the-air homes had an average of 17.7 stations to choose from last year, compared to 11.7 in 1990. Not accounting for the changes wrought by the digital transition, 37 percent could tune in 20 or more; 42 percent could get up to 14 stations, and 9 percent received 30-plus.
Among broadcast households, the average number of channels people actually watch remains relatively constant—the overall average was 4.4 out of 17.7.


Households that received only 8.1 channels tuned into 3.3 on average, or 41 percent. Households getting 15 channels tuned into 4.3, or 29 percent. Those with 25 channels watched 5.0 or 20 percent; 44-channel households watched 6.0 or 14 percent.
PAY TV CHANNEL GROWTH
TV households with cable or satellite had an average of 130 channels, compared to 33 in 1990. Those households tuned into an average of 17.8, or 14 percent of the available roster.
HOURS VIEWED
During the 2007-08 TV season, households tuned in 58 hours and 27 minutes per week, a 40-minute increase from 2007, and an increase of nearly 10 hours from 1990.
Women 18 and older watched the most TV, averaging 37 hours, 52 minutes a week. Men of the same age range averaged 33 hours, 43 minutes.
Prime-time continued to demand the highest proportion of viewing with 24 percent.
SOURCES
Ad-supported cable networks dominated total-day viewing with 58 percent. Broadcast network affiliates took 37 percent. In prime time, cable remained the same while 45 percent of viewers tuned into network affiliates.
PROGRAMMING GENRE
Dramas were tops among genres, comprising 36 percent of prime-time programs. Live variety shows represented 27 percent of the total, followed by comedies with 16 percent.
ADVERTISING
The number of 30-second spots in prime time increased 2 percent, while 15-second ads decreased likewise. Prime-time commercials totaled 12,843, compared to 12,618 in 2007 and 4,990 in 1990.
Advertisers spent $42.3 billion on TV spots in 2008 compared to $41.4 billion in 2007, excluding syndication. Broadcast networks took $22.5 billion, down $1 billion from the year before. Cable nets took $16.6 billion, up $1.9 billion.
The entire report is available here.
(Cover image by Andrea Pi; story image by Susan Smith)
The professional video industry's #1 source for news, trends and product and tech information. Sign up below.
