U.S. Ad Spending Drops 15 Percent During First Half of ’09
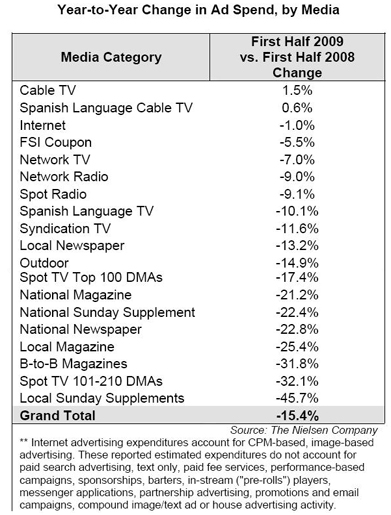
NEW YORK: U.S. advertising across TV, radio, print and billboards fell 15.4 percent during the first half of 2009 compared to the same period a year ago, Nielsen said today. Preliminary figures show that U.S. ad expenditures declined by more than $10.3 billion to a total spend of $56.9 billion in the first two quarters.
The total spend on network TV diminished by 7 percent. (The Television Bureau of Advertising yesterday said network ad revenues were down 5.8 percent during 1H09, from $13.1 billion last year to $12.4 billion this year.) Nielsen said spot TV in the top 100 designated market areas fell 17.4 percent, while the TVB, which derives findings from TNS Intelligence, had spot revenues down by 27 percent during the first half of the year. However, TNS includes both local and national spot in the top 100; Nielsen doesn’t similarly define its sample.
Among the 19 media types Nielsen breaks out, only cable TV and Spanish-language cable posted gains. Cable TV’s take was up 1.5 percent over the six-month period, even though it was down 2.7 during the first quarter. Spanish-language cable spending grew 0.6 percent.
Cable also registered one of the largest increases in ad spending, up nearly $500 million or 62 percent “a direct result of ad buys this year leading up to June’s DTV transition,” Nielsen said.
Among the largest categories, Automotive stayed at the top, though it fell more than 31 percent, from nearly $5.4 billion last year to around $3.7 billion this year. Among local broadcasters, automotive industry spending fell 53 percent during the first half of this year, fro $1.4 billion in 1H08, to $640 million this year, according to TNS.
Fast Food came in at No. 2 among the top 10 with a 5 percent increase, from nearly $2.1 billion last year to $2.2 billion this year. McDonalds, Sonic, Domino’s and Papa John’s were among the franchises that increased spending.
No. 3 Pharmaceutical fell 11 percent, from $2.4 billion to $2.1 billion. No. 4 Wireless Providers grew 1.3 percent to $1.9 billion. At No. 5, Movies generated $1.7 billion, up 1.7 percent from last year. Auto Dealership spending, at No. 6, fell 26 percent to $1.7 billion. Rounding out the top ten were Department Stores, Direct Response, Restaurants and Furniture. Among them, collective ad spending fell 12 percent.
A few categories outside the top 10 put a lot more money into advertising compared to last year. Spending by cell-phone makers doubled. Cable, as mentioned before, spent 62 percent more. Web site ad spending jumped 47 percent. Tax services, software, insurance, legal services, facial moisturizers, financial Web sites and non-university institution spending also grew.
More from TVB on Ad Spending
August 31, 2009: “Local Broadcast Revenues Dive 26 Percent in 2Q”
Total broadcast television ad revenues were down 12.8 percent in the second quarter of 2009 versus the same period last year, according the Television Bureau of Advertising’s analysis of numbers provided by TNS Media Intelligence.

The professional video industry's #1 source for news, trends and product and tech information. Sign up below.
