Video Clarity Updates Log-graphing Tools for ClearView and RTM Systems
CAMPBELL, CALIF. – Video Clarity has officially announced the launch of an updated version of the Excel-based graphing tools the company included with its ClearView and RTM systems. The pair of new software tools plot test data from ClearView- and RTM-generated log files so users can visualize any device performance and network path under test.

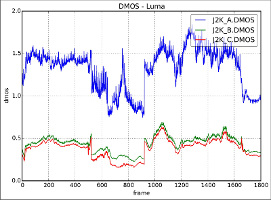
Example of a DMOS-Luma graph
First is the Metric Log Grapher. Able to work for both ClearView and RTM, the Metric Log Grapher automatically groups similar test-log files from a system-generated log folder. Depending on how many different type of tests are in a log folder, the tool automatically creates a comparative overlay graph of each metric type on one or several graphs. The Metric Log Grapher is able to generate a zip folder that contains PDF files of the comparison and summary graphs and their related comma separated value files.
The second new tool is the RTM Log Grapher. Only available for RTM products, this software application creates a graph of system-generated logs that contain minimum, maximum and average scores of RTM systems’ run-time tests. RTM test data can be run for an hour, days or weeks, with the user having the option to select all or part of the data with interactive zoom and scroll functions.
Both products are available immediately, with the Metric Log Grapher shipped with all ClearView and RTM systems. Current Video Clarity customers can receive updates for both.
Get the TV Tech Newsletter
The professional video industry's #1 source for news, trends and product and tech information. Sign up below.
