Video waveform analysis made easy
As mentioned in the previous "Transition to Digital" newsletter, the broadcast television industry is experiencing another behind-the-scenes change bigger than the digital transition itself, which is the changing of the guard in engineering departments. Unlike on-camera stars, the best engineers tend to stay with the same station for decades. They learn the ropes, become a team leader and do their best to keep their station seamless until they retire or die. What some don’t do is to pass along valuable basic information the new engineers replacing them need to know.
Not all stations check the quality of video before or as it is ingested. Just because content comes in a file doesn’t necessarily mean it complies. Baseband video is even more suspicious. Most complies, but don’t assume all incoming content conforms to all audio and video specifications. To quote Ronald Reagan, “Trust but verify.” If you regularly verify, you may begin to develop a “usual suspects” list.
We’ve been discussing audio and the CALM Act lately, so we’ll pass on audio for now. Few tape decks or card docks contain video gain or chroma adjustments, so fixing a video problem without proc amp controls may need to be performed in an edit bay. It’s not efficient but if content isn’t manually verified and fixed before it airs, it can lead to greater problems later. Just because there are no knobs doesn’t mean it can’t be fixed.
Our analog world
Digital video has transformed the technology of television production, transmission and home viewing. However, digital video and audio begins and ends in analog, because light and sound are analog physical sensations. As such, they are captured by analog sensors such as microphones and CCDs, the latter after the analog light has already been processed by a lens and prism. At some point after that, the analog signal is converted to digital data. A digital data stream can be observed on a high-bandwidth oscilloscope, but it is rather impossible to make sense out of until it is converted to analog at the display or speaker.
You might think you could drive your car without gauges and a speedometer, and you probably could — until you are ticketed for speeding or the engine fails without warning. Your success is limited by the laws of physics and governing organizations, exactly as are baseband analog audio and video signals in a broadcast studio. Your dashboard in television production is a waveform monitor and vectorscope. They come in many form factors; stand-alone, rasterizers, built-in, and integrated in computer production and post-production programs. Here, we’ll simply refer to these devices as waveform monitors and vectorscopes. They might all work a little differently, but they all display the same analog information crucial for production, post and digital ingest. They’ve been ubiquitous since the early days of black and white television broadcasting, but the art of understanding them seems to be fading away. The purpose of this tutorial is to reintroduce operators to the basic operation of waveform monitors and vectorscopes.
In the bars
Waveform monitors are useful in system engineering, troubleshooting and in all phases of video content production, post and distribution. It can help verify the technical quality of a live video source, such as a camera. It can help the videographer optimize the iris setting and shot. In post, distribution, digital encoding and ingest, color bars are the ultimate professional reference to make most video measurements and adjustments with a waveform monitor.
Get the TV Tech Newsletter
The professional video industry's #1 source for news, trends and product and tech information. Sign up below.
For monitoring purposes most HD-SDI video is converted to SD-SDI, which is converted to NTSC analog baseband video for waveform and vectorscope displays. Without the use of standard color bars, most adjustments are subjective. The video signal rules operators need to know about are video amplitude, pedestal, chroma amplitude and hue. Before chroma amplitude and hue can be accurately verified with a vectorscope, correct video amplitude and pedestal must be verified with a waveform monitor.
Waveform monitors can be used to find trouble as well as to attain perfection. They provide an easy method to scientifically measure and verify myriad engineering standards of timing, timing relationships and amplitude of video signals, among many other important engineering and systems measurements. The scope of this tutorial is purposely limited to the need-to-know basics for operators.
Let’s start with the most simple and arguably most critical measurement, video amplitude. The correct analog video amplitude in a digital system assures that an optimum number of quantization levels are used in the digitizing process to reproduce the best possible digital picture.
Broadcast engineers have always designed video systems based on unity gain. In a properly designed unity-gain video system, video amplitude corrections made at the source will be identically correct at the output. Amplitude gain adjustments made elsewhere within the system will throw it out of balance and are a bad engineering practice. While your facility may have perfect unity gain throughout, is it safe to assume video from outside sources is as impeccable as yours?
Let’s measure some video

Waveform monitors and vectorscopes can look pretty intimidating. Out of all those buttons and switches on a waveform monitor, most operators only need to know about a few. One is the Flat/Low-pass “Filter” switch, which we’ll get to shortly. The others are the 1 line, 2 line, 1 field, 2 field “Sweep” switches or buttons.
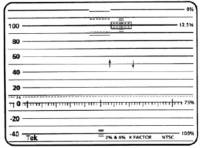
The basic, blank NTSC waveform overlay graticule shown in Figure 1 contains markers to measure all kinds of nuances. But for now we’re interested only in the numbers, called IRE units, on the left column from -40 to 100 and the corresponding horizontal lines. We won’t concern ourselves with the sync portion of the signal, which should extend below zero to -40. The right column of percent numbers is for RF measurements only and otherwise ignored.
To measure video amplitude, switch the waveform monitor “Sweep” to 2 line, switch the “Filter” to low-pass or IRE mode and adjust the vertical position control to vertically center the waveform baseline at zero on the graticule. Low-pass removes the high frequency color information, leaving only luminance. The tips of sync should be at or near the minus 40 line. What we are most interested in observing is the vertical excursion of the luminance video amplitude peaks. In the flat mode, amplitude peaks should never exceed 100 IRE, which is pure white.
Sometimes the brightest visual element in a segment of video content is not pure white, so adjusting amplitude gain without a color bar reference requires a judgment call on the part of the operator. Making the brightest part of the picture content 100 IRE is not necessarily always the right decision. Sometimes less than white is what the director or producer intended. The same concept goes for set-up or pedestal. Black is the darkest part of color bars, and black and should be set at 7.5 or 0, depending on your facility. Perhaps the darkest part of a video content segment is actually gray. Any shade of gray turns to black at 7.5 or 0 IRE, so you can easily find yourself in judgment territory without a color bars reference. Simply stretching all video content to fill the 7.5 or 0 to 100 IRE unit window may not be consistent with the desires of producers, directors or advertisers, which is why a color bars reference is so important. The choice is to use color bars like a scientist or fake it with judgment. Don’t assume anything.
When switched from low-pass to flat mode, the waveform monitor shows luminance and chrominance as shown in Figure 2 (above). Chroma information can drop below zero by approximately 20 IRE units. Chrominance below that point becomes an illegal color. Typically the flat mode is used to adjust chroma gain using the color bars test reference. The far left gray bar should be at 75 IRE (some versions of bars instead use a white bar which should be set at 100 IRE) and chroma peaks of the yellow and cyan bars (following the gray bar, left to right) should be equal at 100. Adjusting chroma gain with a content reference is not good engineering practice. On the other hand, sometimes on-the-fly adjustments of video can’t be avoided, usually because someone up the chain who touched the baseband video wasn’t paying attention or was in a hurry.
The other relevant setting on a waveform monitor is the Field/Line switch. Typically, gain and chroma measurements are made in the 2 line mode. The 2 line mode displays the odd and even fields side by side; left to right in each respective field is time, and the vertical axis represents video amplitude. Field modes 1 and 2 display odd and even fields, but they are not used for adjusting pedestal or video amplitude.
The vectorscope

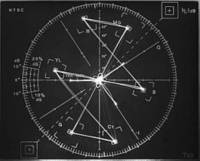
The vectorscope is another important engineering maintenance tool also useful for operators, but not so much without color bars. Without color bars, a vectorscope displays all colors found in the raster within color space. Observing video content on a vectorscope really doesn’t provide much information. To view either accurately, first adjust the rotation control on the vectorscope, and rotate the short burst line coming from the center to align left of the center of the horizontal graticule line as shown in Figure 3. Dots representing solid colors should fall within the boxes on the graticule. Chroma gain will move the dots in and out from the center. Hue will rotate the dots without rotating burst. Any other anomaly is a maintenance issue that could be at the facility that produced the content. That’s why we trust but verify.
There’s one other item worth noting about waveform monitors. They can help evenly light a set. Seasoned lighting experts may argue against this practice, but it works pretty well when there isn’t a seasoned lighting expert around. It’s also less subjective and much less argumentative, but that’s a different story for another day.
Happy Holidays!
The author wishes to thank Tektronix for information and photographs contained in this tutorial.
