An Inexpensive Setup for Rapid DTV Field Measurements

Doug Lung
In my column a few months ago (“Using ASTER for More Accurate Coverage Studies,” Oct. 1), I described how the ASTER terrain database with its 1 second resolution and rough heights of manmade structures could be used with John Magliacane’s SPLAT propagation software to estimate TV coverage in urban areas. The results, however, are only as good as the data entered into the program.
There are significant limitations on even ASTER’s representation real-world terrain and the Longley-Rice propagation model doesn’t take reflections from structures into account. Field measurements, in spite of their inherent inaccuracies, can be useful in seeing what signals actually look like on the ground.
The traditional approach to field measurements, as defined in the FCC rules, relies on a series of measurements taken with an antenna at 30 feet above ground. Few people today use outdoor antennas, let alone antennas on a 30-foot tower, so these measurements are useful mainly for verifying transmit antenna performance and not real-world reception.
THE HARDWARE
Tasked with coming up with a way to measure field strengths from different antenna sites in New York City from many locations in a very short period of time, I came up with a setup using four unamplified Mohu Leaf antennas mounted in the four corners of the roof of a large SUV. Two of the antennas were positioned to be vertically polarized and the other two horizontally polarized.
The Mohu Leaf antenna has a dipole-like pattern so the antennas were mounted orthogonal (90 degree offset) to each other and at a 45-degree angle to the vehicle so that regardless of how the vehicle was pointed there wouldn’t be a case where all antennas had a null in the same direction. Testing showed signal strength was sufficient for both VHF and UHF testing.
This antenna setup provides results more likely to coincide with what viewers will experience with an indoor antenna and greatly simplifies measurements, allowing more locations to be tested. The ability to take measurements at a large number of locations without introducing the potential bias from manually orienting antennas should lead to more accurate indication of true over-the-air coverage.
Measurement of the signals can be accomplished in several different ways. One is to use a spectrum analyzer or other instrument to measure and log channel power. Signal level, however, is not always a good indication of reception.
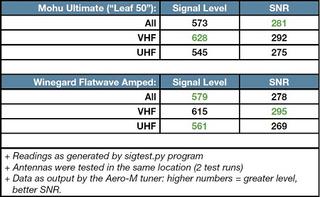
Table 1: Results from Aero-M tuner measurements When the New York City field test plan was first being discussed a few years ago, Oded Bendov argued that signal-to-noise ratio (SNR) rather than channel power was the key criteria. Accurate SNR (or MER— modulation error ratio) measurements require more complex instruments. For the New York City tests, four Rohde & Schwarz ETL analyzers will be used along with R&S’s Drive Test software package. This will provide signal level, SNR, bit error rate (BER), packet error rate (PER) and a channel response (adaptive equalizer tap energy showing echoes time and amplitudes) for each channel and each antenna at each location—a huge amount of data.
After some testing at various locations, we found that in total, the ETL was able to obtain sync lock on less than one-third of the measurements, meaning that we had channel power (signal level) data but nothing else. To fill in the gaps, I did some testing using the Hauppauge Aero-M USB tuner. Using the LinuxTV DVB utilities “femon” and “azap,” I was able to get tuner status, sync lock, signal level, SNR, BER and uncorrected packet data from the tuner.
Furthermore, the Aero-M locked and provided data on all but a few of the signals measured—failures were rare. However, neither “femon” nor “azap” provided data in a way that was easy to log or to combine with GPS time/location data.
THE SOFTWARE
I found a PERL script created by José Oliver Segura, Nicolas Will and others for DVB measurements that would load a list of channels and log the tuner data for each of them in sequence. I was able to modify it to work with ATSC signals, but it took almost a minute to analyze a channel—far too long if you were measuring 12 channels on four antennas per location.
I ended up writing my own Python program to grab the data, combined it with time/location info from a Python GPS logging program I modified, and output the data to a “csv-formatted” text file that could be imported into any spreadsheet program. The tools that made this possible were Dustin Oprea’s ZapLib C-libraries (https://github.com/dsoprea/ZapLib), his Python wrapper, pyzap, for the libraries and the associated test.py program (both available from https://github.com/dsoprea/PyZap).
In addition to scanning through a table of channels, my program adds a number of features, including the ability to set the number of times the tuner data is recorded (once per second and allowing time to settle); logging of both the last data from the tuner and an average of an adjustable number of readings; and the ability to scan through multiple tuners.
In its current configuration, it was able to scan 11 channels on four tuners in under six minutes. It reads the list of channels from a text file in the same format generated by the LinuxTV “scan” application, making it easy to find all the channels in an area and use a text editor to remove the ones you don’t want to measure.
It should be possible to have the program take measurements from different tuners simultaneously using threads to provide faster measurements, but my program doesn’t currently support that.
One early test of the software was to compare my two favorite, flat, indoor amplified antennas—the Winegard Flatwave Amped and the Mohu Leaf Ultimate (now called the Leaf 50). I took measurements of KABC, KCAL, KTTV, KCOP, KCET, KTLA, KMEX, KNBC, KPXN, KVEA, KCBS and KOCE. Table 1 shows the average of the results for all stations, VHF only and UHF only. As you can see, the two antennas were very close. Overall the Winegard showed slightly higher signal level, but slightly lower SNR than the Mohu. At VHF, the Winegard had less signal level, but slightly better SNR than the Mohu. The Winegard had the highest signal strength at UHF, but lower SNR than the Mohu.
I plan to post a current copy of my signal testing program, some output from the early version I used in the Los Angeles antenna comparison and information on how to use and customize the program on a new website at www.transmitter.com/signal-testing.
Comments and questions are welcome. Email me atdlung@transmitter.com.
Get the TV Tech Newsletter
The professional video industry's #1 source for news, trends and product and tech information. Sign up below.

Doug Lung is one of America's foremost authorities on broadcast RF technology. As vice president of Broadcast Technology for NBCUniversal Local, H. Douglas Lung leads NBC and Telemundo-owned stations’ RF and transmission affairs, including microwave, radars, satellite uplinks, and FCC technical filings. Beginning his career in 1976 at KSCI in Los Angeles, Lung has nearly 50 years of experience in broadcast television engineering. Beginning in 1985, he led the engineering department for what was to become the Telemundo network and station group, assisting in the design, construction and installation of the company’s broadcast and cable facilities. Other projects include work on the launch of Hawaii’s first UHF TV station, the rollout and testing of the ATSC mobile-handheld standard, and software development related to the incentive auction TV spectrum repack. A longtime columnist for TV Technology, Doug is also a regular contributor to IEEE Broadcast Technology. He is the recipient of the 2023 NAB Television Engineering Award. He also received a Tech Leadership Award from TV Tech publisher Future plc in 2021 and is a member of the IEEE Broadcast Technology Society and the Society of Broadcast Engineers.
