Analyzing DTS Coverage With Longley-Rice, SPLAT

In August I tested one of Sid Shumate's fixes to Longley Rice (ITM 1.22) software using KNBC on Mount Wilson. I was able to do this comparison easily using a simple PERL script and the output from John Magliacane's SPLAT program.
Analyzing coverage and interference in a distributed transmission system is not much more difficult, but requires setting parameters based on expected DTV receiver performance. Finally, I will look at Rohde and Schwarz's use of the ATSC A/153 Mobile DTV standard to synchronize transmitters. Simpler, better, cheaper?
TESTING A FIX FOR ITM
In my column, Propagation Models in Perspective, (RF Technology, Aug. 6, 2008), I discussed Shumate's work to uncover and fix errors in the widely used Longley-Rice (ITM 1.22) software. He's been describing his work in the IEEE Broadcast Technology Society Newsletter.
In the spring 2009 newsletter he published a simple fix for one of the subroutines. The zlsq1 subroutine has problems that cause errors in the determination of the terrain roughness factor that get worse with the use of higher-resolution terrain databases. Refer to his article [PDF] for the details and a simple change to fix the itm.cpp file.
This fix works well with terrain databases with 3-second spacing. Shumate has another fix that works with 1-second terrain databases, but I haven't had a chance to test it.
One of the advantages of open source software is that with source code at hand, it is easy to change it. I located the zlsq1 subroutine in the itm.cpp program in the SPLAT directory, made Sid Shumate's changes and compiled a "SPLAT-ss" version of the software.

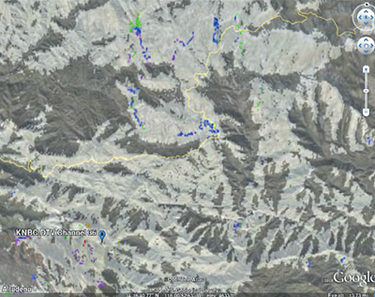
Fig. 1: Cells where the predicted signal was less or stonger after applying the fix are shown in various colors. Using PERL scripts I've described before, I converted the SPLAT text output from modified and unmodified versions of ITM to files mapped to a 3-second grid and then combined them into a single file. Using this file, I was able to change the color of cells with signal levels above 41 dBµV/m where the predicted signal strength differed by more than 1 dB.
Fig. 1 shows a zoomed portion of the map. Cells where the predicted signal was less after applying the fix are shown as yellow, light-orange, dark orange and red representing 1, 2, 3 and 4 or greater dB difference respectively. Cells where the predicted signal after the fix was stronger are shown as bright-green, cyan, blue and violet corresponding to differences of 1, 2, 3 and 4 dB or greater.
As you can see, most of the difference appears in the mountainous areas north of Mount Wilson, where the terrain changes quickly. I was interested in seeing whether there were any changes in the shadows from the buildings in the SRTM terrain database. These shadows are clearly visible in signal strength studies, but there didn't appear to be any difference between the original and fixed versions of ITM. The full image and KML file for Google Earth is available at www.xmtr.com/splat/rf197.
In this study, most of the differences were in sparsely populated areas. However, that may not be the case in other markets. As time allows, I'll be comparing the results from modified and unmodified ITM in other markets.
MAPPING DTS COVERAGE AND INTERFERENCE
My technique for comparing multiple SPLAT studies is to first map them to a 3-second spaced X-Y list (sp3gridproc.pl), combine the data from the two files (3xymulti.pl) and then, for DTS studies, calculate the delay from each transmitter to the point studied (multidelay.pl). The files are available online at www.xmtr.com/splat/perl. The multidelay.pl script will have to be modified with the coordinates of the transmitter sites. The "3xy2png-multi" scripts are used to generate the graph showing any differences in the signal amplitudes or timing.
If you look at these scripts, you will see a long series of "if" statements used to plot a certain color showing signal strength or, if interference is predicted, the D/U ratio for interference that was exceeded. This is where things get complicated.
If the difference between the signal from the two transmitters in a DTS is less than 15 dB (more likely 18 dB in the real world), the performance of the receiver's adaptive equalizer and the time difference between the two signals will determine whether there is interference. What is the best model to use?
The Zenith "5th generation" VSB demodulator is often used as a reference, but it is now several years old and newer chips accept echoes over a much wider range, ±70 microseconds or more, with far better performance with pre-echoes, where the weaker signal arrives before the stronger signal.

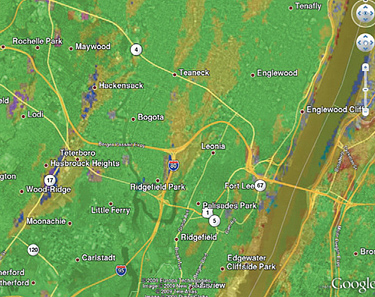
Fig. 2: An area in New Jersey where interference was predicted to the WNJU signal. As noted last month, I'd ignore interference where the D/U is less than 2 dB, as the conditions where the two signals match this closely will be rare and where they do exist, it should be easy to reposition the antenna to eliminate the interference.
Fig. 2 shows an area in New Jersey where interference was predicted to the WNJU signal. These occur primarily in areas shadowed from the West Orange transmitter, but not the 4 Times Square transmitter.
Most reception problems were solved by reducing the signal from one of the sites. Green areas are where signal strength is predicted to be above 88 dBµV/m at 4 m above terrain, dropping in 10 dB steps through green-yellow, yellow, light-orange to dark orange at 48 dBµV/m. Red shows areas between 41 and 48 dBµV/m. Interference is shown in colors ranging from teal, light-blue, blue, violet and magenta for desired to undesired signal ratios ranging from 2 to 15 dB or greater.
Meintel, Sgrignoli & Wallace did a study of the adaptive equalizer performance of DTV set-top boxes and came up a with a median equalizer mask. The work was done for the MTVA, a group of New York-area broadcasters, and has not been released to the public. It is valuable information and I hope at some point it will be published.
Until this information is available, the most current receiver equalizer data is in the CRC publication "Laboratory Evaluation of a VSB Receiver for Terrestrial Broadcasting – Laboratory Tests Report" [PDF] available at. The report describes the Samsung "Gemini" demodulator. Most newer ATSC receivers should meet or exceed this performance.
When time allows, I intend to combine and modify the PERL scripts I've been developing for use with SPLAT to make them more user friendly while still keeping them simple enough for users to modify to generate customized maps.
When working with the scripts, watch out for the temporary files they generate. For a study covering 4 degrees on a side, the data files are around half a gigabyte in size! These can eat up hard drive space very quickly. Since the same file names are used in each run, you'll need to rename the file you want to keep to a new name (the Linux "mv" command).
To save time and disk space, rather than copying renamed files to the input file names needed by the scripts, use a symbolic link (Linux "ln" command) to link a file like "knbc_splat_xy1.txt" to "splat_xy1.txt" or "knbc_ss-splat_xy2.txt" to "splat_xy2.xt." I've also found it handy to make a subdirectory for the PERL scripts and a separate subdirectory (for example, "knbc-dt") for each station being studied.
USING THE ATSC MOBILE DTV STANDARD
In past columns I've outlined how ATSC standard A/110 allows multiple transmitters to be synchronized into a distributed transmission system—DTS (also called a "single frequency network" or SFN). The distributed transmission systems I've had the opportunity to test this year in New York City with WNJU, and at the NAB Show in Las Vegas with KBLR, did not use the A/110 standard. Instead, both of these Rohde and Schwarz systems were transmitting an A/153 Mobile DTV stream and used features present in the ATSC candidate standard to synchronize the transmitters.
This is possible because, for one thing, generating the training sequences in A/153 requires initializing the ATSC trellis encoders to a known state. The A/153 signal is also synchronized to a single global reference time, ATSC time. With a known data stream and a time reference, Rohde and Schwarz was able to synchronize the transmitters. Offset from the reference time is set in the encoders.
I haven't had a chance to set up an A/110 distributed transmission system, but from what I know about A/110, the Rohde and Schwarz approach seems simpler if the station is transmitting mobile DTV. As with A/110, a GPS reference is required at the studio and at each transmitter. A GPS-locked network time protocol (NTP) generator is needed at the studio for the A/153 stream.
Both WNJU and KBLR were transmitting mobile DTV and except for the transmitter-site GPS units no additional equipment was needed to synchronize the transmitters.
The simplicity of the Rohde and Schwarz DTS system makes sense if the station is broadcasting or planning to broadcast a mobile DTV signal. It probably doesn't make sense to install the mobile DTV multiplexer and exciter just to synchronize transmitters. While no new hardware, other than the GPS, is required to synchronize the Rohde and Schwarz exciters, there is a license fee to turn on this capability.
I've heard concerns that changes to A/153 may "break" this synchronization method because this functionality isn't part of A/153. I don't see this happening as the mobile DTV signal has to be deterministic and, to allow time slicing, locked to a stable time reference. I'll have more details in a future column.
Comments are welcome! E-mail me at dlung@transmitter.com.
The professional video industry's #1 source for news, trends and product and tech information. Sign up below.

Doug Lung is one of America's foremost authorities on broadcast RF technology. As vice president of Broadcast Technology for NBCUniversal Local, H. Douglas Lung leads NBC and Telemundo-owned stations’ RF and transmission affairs, including microwave, radars, satellite uplinks, and FCC technical filings. Beginning his career in 1976 at KSCI in Los Angeles, Lung has nearly 50 years of experience in broadcast television engineering. Beginning in 1985, he led the engineering department for what was to become the Telemundo network and station group, assisting in the design, construction and installation of the company’s broadcast and cable facilities. Other projects include work on the launch of Hawaii’s first UHF TV station, the rollout and testing of the ATSC mobile-handheld standard, and software development related to the incentive auction TV spectrum repack. A longtime columnist for TV Technology, Doug is also a regular contributor to IEEE Broadcast Technology. He is the recipient of the 2023 NAB Television Engineering Award. He also received a Tech Leadership Award from TV Tech publisher Future plc in 2021 and is a member of the IEEE Broadcast Technology Society and the Society of Broadcast Engineers.
