Comparing IOPS for SSDs and HDDs
In my April column (“Putting the IOPS Where They Count”), the generalities of Input Output Operations (per second) or IOPS were explored from the physical device that is the hard disk drive (HDD) perspective.
We learned how the combination of disk drives in arrays can support the specific workload requirements of a system. Also discussed was a seldom-addressed factor called the “RAID penalty,” the impact of selecting a given RAID-level against the overall total system IOPS.
Continuing on this theme, solid-state devices (i.e., drives or disks)—known as SSDs—have a different set of impacts on the overall normalized IOPS equation. It is a fairly well-known fact that SSDs will age based upon the number of erase cycles the device is put through over the course of its normal use. Flash memory physics, a primary component of the SSD, is a contributing factor as to how IOPS performance will change.
Specifications for read/write performance are often given for SSDs, and Flash, at the time of their initial placement into service. What is surprising is that performance can (and will) change, sometimes dramatically, once the device is placed into service. This figure is irrespective of the number of erase cycles, but certainly dependent upon the SSD time in service and the number of read/write cycles, with or without erasures.
DIFFERENTIATING IOPS
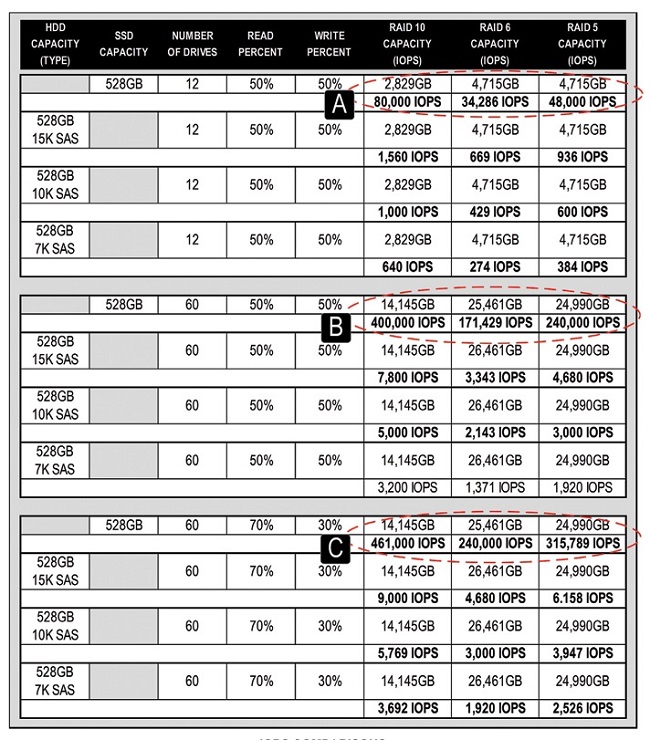
Table 1: Dramatic IOPS comparison of the same equivalent storage sizes for SSD versus HDD. (A) is for a 12-drive, 50/50 read-write workload; (B) for a 60-drive, 50/50 load; and (C) for a 60-drive 70/30 workload. Note the variations in HDD rotations speeds (15K, 10K and 7K RPM) and the impacts on IOPS for each set of spinning disk arrays.

There are amazing differences in IOPS for SSD versus conventional spinning disks. Take, for example, a spinning disk array made of 10K RPM SAS drives, each in the modest 528 GB capacity (pretend they make such a drive). Given a 50/50 workload ratio of read/write and 12 drives in the array, for a RAID 6 configuration the usable capacity would be 4.7 TB—and the I/O performance would be 429 IOPS. A RAID 5 configuration would be the same usable storage, but IOPS increases to 600 (thus the meaning of the term “RAID Penalty”).
Apply the same configuration in terms of the same number of SSD drives, the same total usable capacity and a 50/05 workload, and the IOPS climb to 34,286 for RAID 6 and 48,000 for RAID 5. That is nearly an 80x increase at RAID 5 and RAID 6 over the HDD.
For a different perspective, change the read/write ratio from 50/50 to 70-percent read and 30-percent write. For the same HDD configurations, the performance for RAID 6 now increase from 429 to 600 IOPS; and for RAID 5, the change goes from 600 to 789 IOPS. For the SSD equivalent, the RAID 6 performance goes from 34,286 to 48,000 IOPS; and for RAID 5 the change is from 48,000 IOPS to 63,156. The increase between HDD and SSD is still an 80x improvement regardless of the RAID configuration. (See Table 1 for additional comparisons.)
CHANGING THE LANDSCAPE
You can easily see why the popularity of SSD in personal laptops, tablets and smartphones (whether you realized they were installed or not) has dramatically changed the overall system performance landscape. But how are these specifications measured, and how are they marketed?
A technical tutorial provided by SNIA (Storage Networking Industry Association) at the January 2015 Storage Visions conference in Las Vegas revealed some surprising issues about how the SSD is rated—especially in its new versus “broken-in” or “steady” states.
Performance of an SSD is about how well it functions at accessing, saving or retrieving the bits. This should be understood independently from the network, the application or any other processes or operations that could influence, negatively, the net overall performance. There are specific metrics used to judge or measure performance—more on this in a bit.
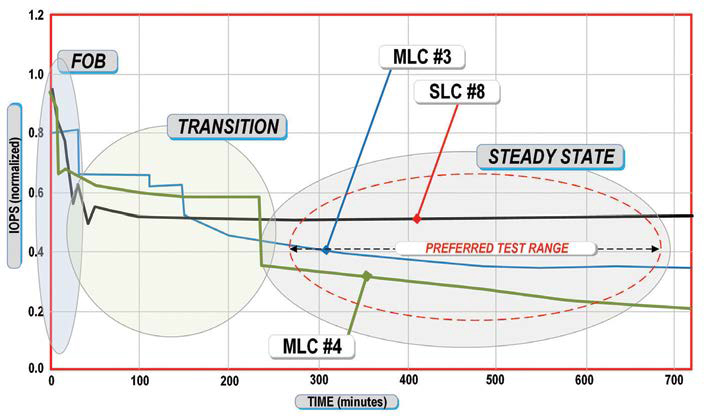
Fig. 1: This graph shows the impacts on drive aging. The STEADY STATE region is the time period used for the measurement, per the suggestions in the SNIA testing document. Note the TRANSITION period between FOB (“fresh-out-of-the-box) and the STEADY STATE (preferred test range) where the IOPS performance will dramatically change.

However, it should be recognized that SSD performance changes over time. There is a period between the “fresh-out-of-the-box” (FOB) and the “steady state” period where there is a “transition” period. The normalized IOPS performance, depending upon the type of memory’s multilevel cell structure, will actually do a step-function—negatively—from a peak FOB IOPS figure to the steady state IOPS measurement. (See Fig. 1 for selected relative comparisons.)
When developing a “level of performance” metric, the measurements will depend upon the type of IO request. The influencing metrics include whether the SSD access is sequential or random in nature, and varies based upon the size of the blocks, the read/write workload (as exemplified from the previous comparison) and how the IO access blocks are physically arranged on the media itself (known as “block alignment”).
Another factor for the performance is the duration of the writes in terms of continuous activity, based upon the number of hours of 100-percent writes across a specified block size (e.g., 4KiB = 4096 kilobytes; the kibibyte [KiB] being a 1000-unit byte for quantities of digital information).
SNIA has addressed a standardized measurement model for ensuring that the same perspectives can be applied across many SSDs. This procedure is detailed in the document “Solid State Storage Performance Test Specification” (PTS), developed, published and validated by SNIA.
How the SSD is used and for what purposes has a lot to do with how well and how long the device will perform and at what performance levels. Enterprise class implementations require much higher overall performance than what is generally put into the market for generic or consumer applications. Enterprise class devices are expected to be run at full workload and under steady state conditions 24/7; so they are tested (and hopefully spec’d) in those environments.
These are the types of devices most often found in professional applications, and for SSDs can come aggregated in all forms of storage configurations (DAS, NAS, SAN) and in as RAID or Tiered storage solutions.
IOPS OR LATENCY
IOPS become important metrics in both consumer and enterprise operations. That said, the management of response times (i.e., the mitigation of latencies) becomes a most important and overriding factor for what are considered high-level IOPS devices. Enterprise class SSDs with comparable IOPS may in actual practice differ significantly in response times and latencies.
Which leads us to the application—another contributing factor that can substantially change the need for some operational statistics in the storage device and physical media type. Random instances of activities that generate high response-time “spikes” become evident and obvious as the spinning gear appears and activities wait for the settling time in memory access.
For media-centric activities, this impact is apparent in editing systems, MAMs, VOD and other activities where high volumes of metadata read/writes are present. When the file is of a contiguous large size—stored sequentially on a storage medium—the read/write performance impact can be relatively insignificant.
However, for the editorial process or for graphics rendering, there are often hundreds of smaller files that are being acted upon, and are often spread randomly across the storage device. Any latency in writing the blocks or in accessing the file chunks will dramatically change performance, making SSDs ideal for metadata and high-volume database activities and potentially unnecessary for contiguous file retrieval.
For video server devices with content caching just ahead of playout, an HDD will provide a suitable real-time performance, assuming it was selected properly and designed for those activities. SSDs can provide improvements (as in VOD systems), but the HDD is, so far, a more economical solution—at least for most long-form content.
That, in a nut shell, is an overview of the issues surrounding SSD performance and a brief introduction on why the IOPS for the HDD is significantly different for an SSD. Later, we’ll look at more recent developments in the cell-structure of NAND, Flash and other SSD devices, and how those improvements influence the performance of SSDs.
In the meantime, choose your SSD wisely and know your application before deciding to wholesale forklift your space-taking, power-consuming, maintenance-intensive disk arrays.
Karl Paulsen, CPBE and SMPTE Fellow, is the CTO at Diversified Systems. Read more about other storage topics in his book “Moving Media Storage Technologies.” Contact Karl atkpaulsen@divsystems.com.
Get the TV Tech Newsletter
The professional video industry's #1 source for news, trends and product and tech information. Sign up below.

Karl Paulsen recently retired as a CTO and has regularly contributed to TV Tech on topics related to media, networking, workflow, cloud and systemization for the media and entertainment industry. He is a SMPTE Fellow with more than 50 years of engineering and managerial experience in commercial TV and radio broadcasting. For over 25 years he has written on featured topics in TV Tech magazine—penning the magazine’s “Storage and Media Technologies” and “Cloudspotter’s Journal” columns.
