Using TVStudy to Map Coverage, Interference

Doug Lung
In my last column ("Installing the FCC's TVStudy in 24 Easy Steps", RF Technology, April 1), I described installing the FCC TVStudy software on Linux, with a specific focus on Arch or its easier-to-install derivative Manjaro.
TVSTUDY UPDATES
In late April the FCC released an update that fixed a bug in the cell calculation routines that caused the program to crash on some stations discovered by David Fort. (WYDN using the “Global” cell option is one example.)
Thanks to the efforts of Mark Colombo, the fix included a compiled 64-bit “tvstudy” binary that I found runs fine under Arch or Manjaro, avoiding the need to compile the software.
Details on the Linux TVStudy are available here.
These instructions should work as is for Ubuntu 12.04.2 or derivatives. If you want to compile the program under Arch you will need my modified Makefile. The FCC’s new “tvstudy.” file works fine as is—you won’t need my modified version.
After following the instructions on the FCC’s TVStudy page or the instructions in my earlier column and running the example study you will have several output files with names starting with knbc_default.
The knbc_default.txt file lists the parameters used for the study and shows area and population for noise-limited (inside the contour), terrain-limited (shadowed areas removed) and interference-free (cells with interference removed) coverage.

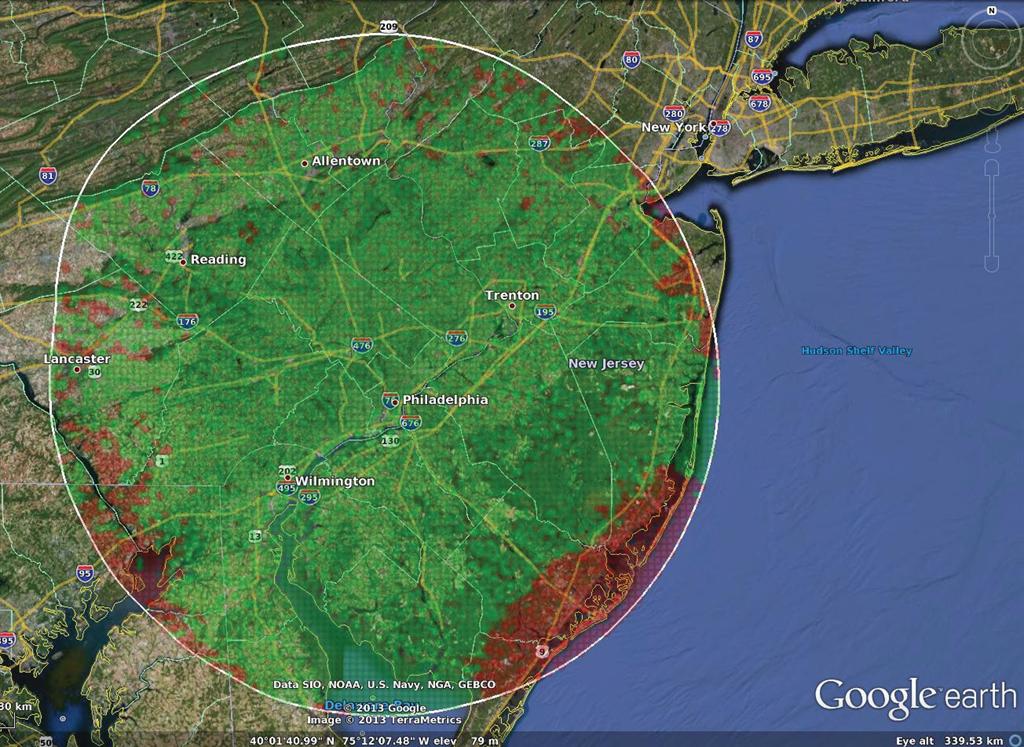
Fig. 1: WCAU TVStudy Coverage Map
(Click to Enlarge)
The sources of interference are shown along with the amount of total and unique interference. The percentage of interference is not shown, but can be easily calculated by adding a formula to the knbc_default.csv spreadsheet. The knbc_default.cel file has data on the desired and undesired signals and population in each cell. See the _readme_ cel_file.txt file on the FCC TVStudy page for details.
PLOTTING ON GOOGLE EARTH
While this information is very useful, it would be nice if there was a way to display the TVStudy output on a Google Earth map. It is very easy to do this with the ogr2ogr program available in gdal. For Arch/Manjaro Linux, install it using: sudo pacman -S gdal (see www.gdal.org/ogr/ for details on the OGR Library). It is available in the FWTools GIS Binary Kit for both Windows and Linux.
The program will allow you to convert the data points and shapefiles in the prj, dbf, shp and shx files generated by TVStudy into kml files for display in Google Earth.
The coverpts files include the result of the interference study for each cell coded as 1, 2 or 3:
1 = interference free coverage
2 = coverage lost to interference
3 = signal below threshold (coverage lost to terrain).
I used TVStudy to do a study of WCAU (Philadelphia) coverage with 2 kilometer cells and the default FCC OET-69 parameters— you’ll need to change “True Geometry” to “Effective Height” to duplicate my study.
This station provides a good example of the interference situation in the northeast and the need to protect coverage of existing cells, not just total coverage numbers, in a repacking. Follow the steps in my last column and create a wcau_int scenario output file set.
To generate a map with a placemark at every cell, use the command:
ogr2ogr -f kml WCAU_cell_coverage.kml wcau_int_coverpts.shp.
The “-f kml” sets the output to kml, the name of the kml file to write follows it, and the input file to use is the last parameter. Opening the kml file in Google Earth you will see a yellow pin placemark for each cell. Zoom into the map until you can see the individual pins. Depending on the speed of your computer, it might take a few minutes to load all the pins. Click on each pin and you will see the result—1, 2 or 3—for that cell.
While this is useful for checking coverage at specific locations, it would be nice to have different colored pins for each result. Fortunately, this is easy to do with ogr2ogr by adding -where RESULT=1 before the -f parameter. Change the RESULT=number to 2 or 3 to see cells impacted by interference or terrain, respectively. For example:
ogr2ogr -where RESULT=1 -f kml WCAU-intfree.kml wcau_int_coverpts.shp will generate a kml file showing only the interference free cells. Rerun ogr2ogr with ogr2ogr -where RESULT=2 -f kml WCAU-interference. kml wcau_int_coverpts.shp to create a second kml file showing cells with interference.
Load both files into Google Earth. This is a bit better than before because it doesn’t show cells with signal below threshold, but you still can’t tell which cells are lost due to interference without clicking on the cell. This is easy to fix. Right click on the wcau-int-free.kml entry under Temporary Places in the Places menu and select properties. Click on the “Style, Color” tab. Ignore the warning and click “Share Style.”
Click on the little pin to the right of the file name and pick a green pin. Now all of the interference free cells will show up in green, while the cells lost to interference will remain yellow; these are easily changed. Play around with the “Style, Color” properties to get the best looking map.
I found using the shaded circle, changing the color in the “Icon” line in the “Style, Color” box to green (for interference cells) or red (for cells with interference), the scale to 0.8 and opacity to 25 percent worked well.
Create a contour for the map using:
ogr2ogr -f kml WCAU_contour.kml wcau_int_contours.shp
The kml uses line strings to display the contour. You may need to install libpng if ogr2ogr complains about a missing file. Load the contour file in Google Earth and change the color and line width as desired. My creation is shown in Fig. 1.
The files used to create this map are available at http://xmtr.com/RF238 so you can generate some maps with ogr2ogr before installing TVStudy.
I’ve figured out how to put Sid Shumate’s fixes for programming errors in the C code version of Longley-Rice 1.22 into the Fortran code used in TVStudy’s itsitm.f Longley-Rice program. I’m currently running studies comparing results using the FCC Fortran code with the corrected Fortran code at different terrain resolutions. Look for the results in a future column.
If you have any issues installing or running TVStudy and the ogr2ogr conversion program email me at dlung@transmitter.com and I’ll try to help or point to websites or documents with additional information.
Get the TV Tech Newsletter
The professional video industry's #1 source for news, trends and product and tech information. Sign up below.

Doug Lung is one of America's foremost authorities on broadcast RF technology. As vice president of Broadcast Technology for NBCUniversal Local, H. Douglas Lung leads NBC and Telemundo-owned stations’ RF and transmission affairs, including microwave, radars, satellite uplinks, and FCC technical filings. Beginning his career in 1976 at KSCI in Los Angeles, Lung has nearly 50 years of experience in broadcast television engineering. Beginning in 1985, he led the engineering department for what was to become the Telemundo network and station group, assisting in the design, construction and installation of the company’s broadcast and cable facilities. Other projects include work on the launch of Hawaii’s first UHF TV station, the rollout and testing of the ATSC mobile-handheld standard, and software development related to the incentive auction TV spectrum repack. A longtime columnist for TV Technology, Doug is also a regular contributor to IEEE Broadcast Technology. He is the recipient of the 2023 NAB Television Engineering Award. He also received a Tech Leadership Award from TV Tech publisher Future plc in 2021 and is a member of the IEEE Broadcast Technology Society and the Society of Broadcast Engineers.
